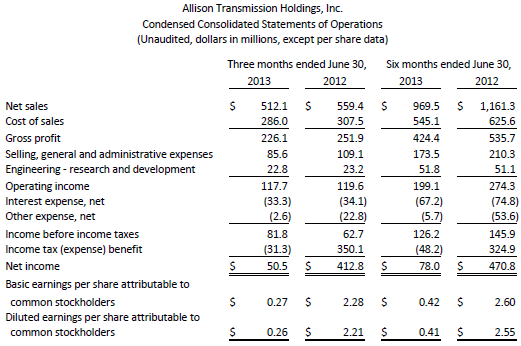
INDIANAPOLIS, July 29, 2013 /PRNewswire/ -- Allison Transmission Holdings Inc. (NYSE: ALSN), the largest global provider of commercial duty fully-automatic transmissions and hybrid-propulsion systems, today reported net sales for the quarter of $512 million, an 8 percent decrease from the same period in 2012. Adjusted Net Income, a non-GAAP financial measure, for the quarter was $89 million, compared to Adjusted Net Income of $87 million for the same period in 2012, an increase of $2 million. Diluted earnings per share for the quarter were $0.26.
(Logo: http://photos.prnewswire.com/prnh/20120702/DE33547LOGO )
The decrease in net sales was principally driven by lower demand in the North America energy sector's hydraulic fracturing market, relative to the same period in 2012, previously considered reductions in U.S. defense spending and weakness in the Outside North America Off-Highway mining sector end market. Partially offsetting these declines were higher demand for North America hybrid-propulsion systems for transit buses principally driven by intra-year movement in the timing of orders and strength in the Outside North America Off-Highway energy sector end market. Net sales to the North America On-Highway end market, our largest, were flat with the same period in 2012, an improvement relative to the year-over-year performance in the first quarter.
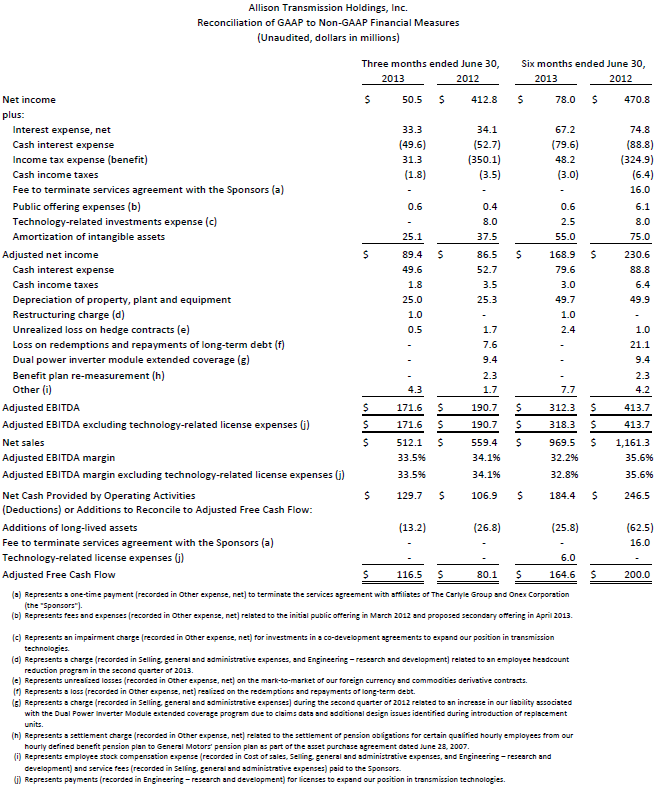
Adjusted EBITDA, a non-GAAP financial measure, for the quarter was $172 million, or 33.5 percent of net sales, compared to $191 million, or 34.1 percent of net sales, for the same period in 2012. Adjusted Free Cash Flow, also a non-GAAP financial measure, for the quarter was $117 million compared to $80 million for the same period in 2012.
Lawrence E. Dewey, Chairman, President and Chief Executive Officer of Allison Transmission commented, "In the second quarter, Allison continued to demonstrate strong operating margins and cash flow by executing initiatives to proactively align costs and programs across our business as our revenue trajectory improved relative to the first quarter of the year. The anticipated near-term improvement in global On-Highway end markets notwithstanding, we will continue to aggressively align costs and investments with growth plans and our commitments to cash flow generation and the return of capital to shareholders."
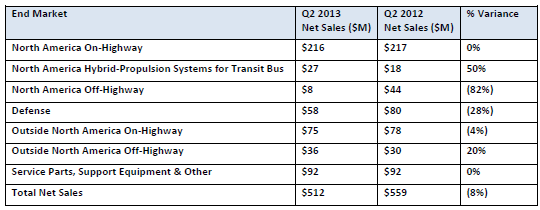
Second Quarter Net Sales by End Market
Second Quarter Highlights
North America On-Highway end market net sales were flat with the same period in 2012 and up 15 percent sequentially, principally driven by higher demand for Rugged Duty and Bus Series models.
North America Hybrid-Propulsion Systems for Transit Bus end market net sales were up 50 percent from the same period in 2012 principally driven by intra-year movement in the timing of orders.
North America Off-Highway end market net sales were down 82 percent from the same period in 2012 principally driven by lower demand from hydraulic fracturing applications, but for the first time in five quarters, essentially flat sequentially.
Defense end market net sales were down 28 percent from the same period in 2012 principally driven by continued reductions in U.S. defense spending to longer term averages experienced during periods without active conflicts.
Outside North America On-Highway end market net sales were down 4 percent from the same period in 2012 reflecting weakness in China, principally driven by the timing of bus tenders, and commercial vehicle production schedule volatility in several other regional end markets, partially offset by improved demand conditions in Europe.
Outside North America Off-Highway end market net sales were up 20 percent from the same period in 2012 principally driven by strength in the energy sector, partially offset by weakness in the mining sector.
Service Parts, Support Equipment & Other end market net sales were flat with the same period in 2012.
Gross profit for the quarter was $226 million, a decrease of 10 percent from gross profit of $252 million for the same period in 2012. Gross margin for the quarter was 44.2 percent, a decrease of 80 basis points from a gross margin of 45.0 percent for the same period of 2012. The decrease in gross profit from the same period in 2012 was principally driven by decreased net sales, partially offset by favorable foreign exchange.
Selling, general and administrative expenses for the quarter were $86 million, a decrease of 22 percent from selling, general and administrative expenses of $109 million for the same period in 2012. The decrease was principally driven by $12 million of lower intangible asset amortization, a $9 million charge for the Dual Power Inverter Module ("DPIM") extended coverage program in 2012 and reduced global commercial spending activities, partially offset by $2 million of higher employee stock compensation expense.
Engineering – research and development expenses for the quarter were $23 million, essentially flat with the same period in 2012.
Second Quarter Non-GAAP Financial Measures
Adjusted EBITDA for the quarter was $172 million, or 33.5 percent of net sales, compared to $191 million, or 34.1 percent of net sales, for the same period in 2012. The decrease in Adjusted EBITDA from the same period in 2012 was principally driven by decreased net sales, partially offset by reduced global commercial spending activities.
Adjusted Net Income for the quarter was $89 million compared to $87 million for the same period in 2012. The increase in Adjusted Net Income was principally driven by reduced global commercial spending activities, decreased cash interest expense as a result of debt repayment and refinancing, $8 million of premiums and expenses in 2012 related to redemptions of long-term debt, and a $9 million charge for the DPIM extended coverage program in 2012, partially offset by decreased net sales and higher employee stock compensation expense.
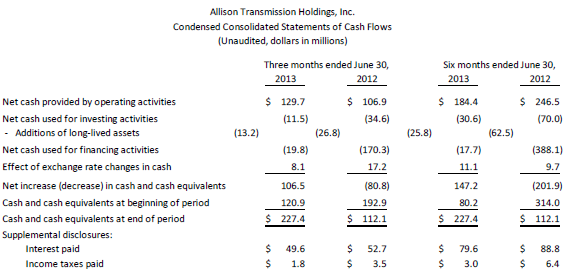
Adjusted Free Cash Flow for the quarter was $117 million compared to $80 million for the same period in 2012. The increase was principally driven by increased net cash provided by operating activities and reduced capital expenditures. The decrease in capital expenditures was principally driven by the 2012 expansion of our India facility and lower 2013 product initiatives spending.
Full Year 2013 Guidance Update
Our updated full year 2013 guidance includes Adjusted EBITDA excluding technology-related license expenses in the range of $630 to $660 million and Adjusted Free Cash Flow in the range of $325 to $375 million, consistent with the ranges for such measures implied in our prior guidance ranges. We expect to achieve these levels on revised net sales for full year 2013 in the range of $1,920 to $1,960 million, implying an Adjusted EBITDA margin excluding technology-related license expenses in the range of 32 to 34 percent, consistent with our prior Adjusted EBITDA margin excluding technology-related license expenses guidance.
In the second half of 2013, we expect net sales to stabilize on a year-over-year basis, an improvement relative to the sales decline in the first half of the year. We believe there are improving trends in the second half of 2013 which we expect to be driven by strong year-over-year growth in global On-Highway end markets and abating year-over-year declines in the North America Off-Highway end market. We continue to focus on delivering our Adjusted EBITDA excluding technology-related license expenses and Adjusted Free Cash Flow commitments through the execution of initiatives that align costs and programs across our business with end markets demand conditions. We also believe Allison is well positioned for a cyclical recovery in the North America On-Highway end market while supporting its Outside North America growth plans. Finally, we are updating our full year 2013 guidance for capital expenditures to a range of $75 to $85 million and cash income taxes to a range of $10 to $15 million.
Conference Call and Webcast
The company will host a conference call at 4:30 p.m. EDT on Monday, July 29 to discuss its second quarter 2013 results. Dial-in number is 719-325-2463 and the U.S. toll-free dial-in number is 888-510-1765. The passcode for the call is 5027232. A live webcast of the conference call will also be available online at http://ir.allisontransmission.com.
For those unable to participate in the conference call, a replay will be available from 7:30 p.m. EDT on July 29 until 11:59 p.m. EDT on August 5. The replay dial-in number is 858-384-5517 and the U.S. toll-free replay dial-in number is 877-870-5176. The replay passcode is 5027232.
About Allison Transmission
Allison Transmission is the world's largest manufacturer of fully-automatic transmissions for medium- and heavy-duty commercial vehicles, medium- and heavy-tactical U.S. defense vehicles and hybrid-propulsion systems for transit buses. Allison transmissions are used in a variety of applications including on-highway trucks (distribution, refuse, construction, fire and emergency), buses (primarily school and transit), motor homes, off-highway vehicles and equipment (primarily energy and mining) and defense vehicles (wheeled and tracked). Founded in 1915, the Allison business is headquartered in Indianapolis, Ind., USA and employs approximately 2,800 people. Allison has manufacturing facilities and customization centers located in China, The Netherlands, Brazil, India and Hungary. With a global presence, serving customers in North America, Europe, Asia, Australia, South America, and Africa, Allison also has approximately 1,400 independent distributor and dealer locations worldwide. More information about Allison is available at www.allisontransmission.com.
Forward-Looking Statements
This press release may contain forward-looking statements. All statements other than statements of historical fact contained in this press release are forward-looking statements, including all statements regarding future financial results. In some cases, you can identify forward-looking statements by terminology such as "may," "will," "should," "expect," "plans," "project," "anticipate," "believe," "estimate," "predict," "intend," "forecast," "could," "potential," "continue" or the negative of these terms or other similar terms or phrases. Forward-looking statements are not guarantees of future performance and involve known and unknown risks. Factors which may cause the actual results to differ materially from those anticipated at the time the forward-looking statements are made include, but are not limited to: risks related to our substantial indebtedness; our participation in markets that are competitive; the highly cyclical industries in which certain of our end users operate; the failure of markets outside North America to increase adoption of fully-automatic transmissions; the concentration of our net sales in our top five customers and the loss of any one of these; future reductions or changes in government subsidies for hybrid vehicles, U.S. defense spending; general economic and industry conditions; the discovery of defects in our products, resulting in delays in new model launches, recall campaigns and/or increased warranty costs and reduction in future sales or damage to our brand and reputation; our ability to prepare for, respond to and successfully achieve our objectives relating to technological and market developments and changing customer needs; risks associated with our international operations; and labor strikes, work stoppages or similar labor disputes, which could significantly disrupt our operations or those of our principal customers. Although we believe the expectations reflected in such forward-looking statements are based upon reasonable assumptions, we can give no assurance that the expectations will be attained or that any deviation will not be material. All information is as of the date of this press release, and we undertake no obligation to update any forward-looking statement to conform the statement to actual results or changes in expectations.
Use of Non-GAAP Financial Measures
This press release contains information about Allison's financial results which are not presented in accordance with accounting principles generally accepted in the United States ("GAAP"). Such non-GAAP financial measures are reconciled to their closest GAAP financial measures at the end of this press release. Non-GAAP financial measures should not be considered in isolation or as a substitute for our reported results prepared in accordance with GAAP and, as calculated, may not be comparable to other similarly titled measures of other companies.
Attachment
- Condensed Consolidated Statements of Operations
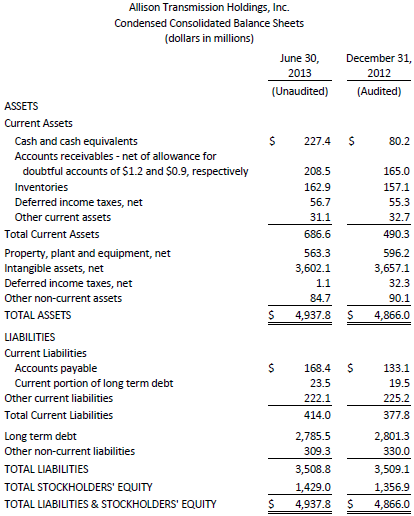
- Condensed Consolidated Balance Sheets
- Condensed Consolidated Statements of Cash Flows
- Reconciliation of GAAP to Non-GAAP Financial Measures
SOURCE Allison Transmission Holdings Inc.
Investor Relations, (317) 242-3078, ir@allisontransmission.com; Media Relations, (317) 242-5000, media@allisontransmission.com